This blog aims to document how to create/configure Log Analytics based Alert and Monitoring solutions and enable and implement Log-based Alert and Monitoring
Introduction
Alerts and Monitoring can be enabled and setup by using logs stored in Log Analytics workspace.
The Dashboards (Workbook) can be created to show useful information like Business milestones, errors and exceptions.
Design
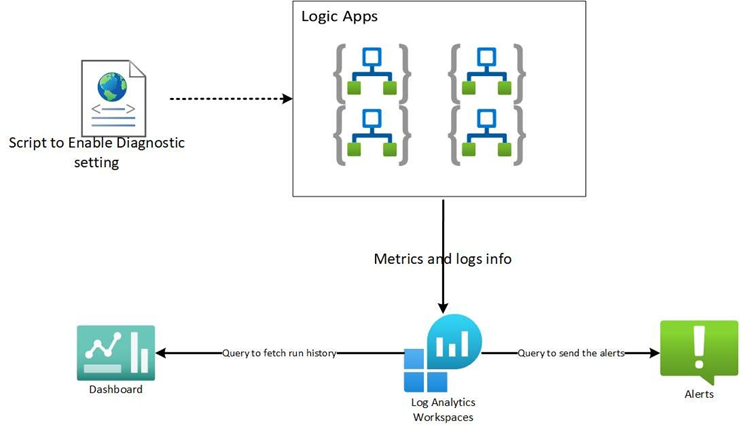
In order to implement Log Analytics logs based alerts and monitoring solutions, the Diagnostics setting to be enabled for the logic apps which are to be monitored.

Once the diagnostics settings are enabled, the logs and metrics information start flowing into Log Analytics workspace.
KQLQueries
The Kusto queries to be fired to fetch the error\status of run history of logic apps.
Please find below the sample KQL query to fetch the run history of the logic app.
Query to get the status of LogicApps’ runs
AzureDiagnostics
|  where ResourceType == "WORKFLOWS/RUNS"
|  where OperationName has "workflowRunCompleted"
|  summarize dcount (resource_runId_s) by resource_workflowName_s, status_s
|  project resource_workflowName_s, status_s, dcount_resource_runId_s
|  join (
AzureDiagnostics
|  where ResourceProvider == "MICROSOFT.LOGIC"
|  where OperationName has "workflowRunCompleted"
|  project
TimeGenerated,
resource_workflowName_s,
resource_runId_s,
status_s)
on resource_workflowName_s,status_s
|  project
Time = TimeGenerated,
Name = resource_workflowName_s,
RunId = resource_runId_s,
Status = status_s,
ExecutioncCount = dcount_resource_runId_s
| order by Time, Name

Query for Failed count:
AzureDiagnostics
|  where ResourceType == "WORKFLOWS/RUNS"
|  where OperationName has "workflowRunCompleted" and status_s =="Failed"
|  summarize dcount(resource_runId_s) by resource_workflowName_s,status_s
|  project resource_workflowName_s, status_s,dcount_resource_runId_s

Query to find the runid which took more time than the average execution time :
AzureDiagnostics
 | where ResourceType == "WORKFLOWS/RUNS"
 | where OperationName has "workflowRunCompleted"
 | summarize avg(endTime_t-startTime_t) by resource_workflowName_s
 | join (
AzureDiagnostics
| where ResourceProvider == "MICROSOFT.LOGIC"
| where OperationName has "workflowRunCompleted"
| project
TimeGenerated,
ExecTime=endTime t-startTime t,
resourceworkflowName_s,
resource runId_s,
Sstatus_s)
on resource_workflowName_s
| project
Time =TimeGenerated,
Name = resource _workflowName_s,
RunId = resourcerunId_s,
AvgExecTime = avg,
ExecTime,
Status = status s
| order by Time,Name
| where (ExecTime) > (ExecTime)
Based on the result of the query, the alert can be sent.
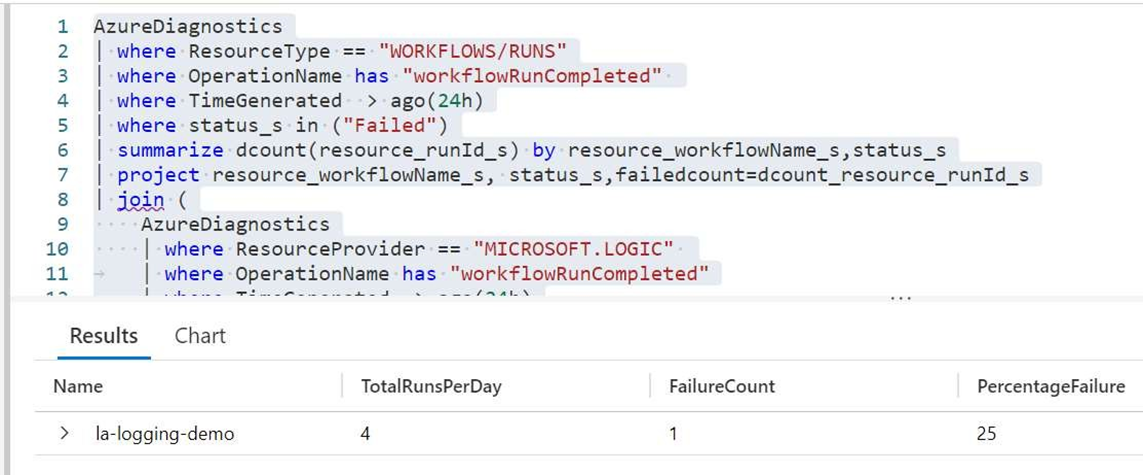
Showcase Failure Percentage and Total Runs\Load in a day – Below Query gives the Percentage of Failures and Total runs in last 24 hours which can be changed as per the requirement.
AzureDiagnostics
| where ResourceType == "WORKFLOWS/RUNS"
| where OperationName has "workflowRunCompleted"
| where TimeGenerated > ago(24h)
| where status_s in ("Failed")
| Summarize dcount(resourcerunId_s) by resourceworkflowName_s,status_s
| project resourceworkflowName_s, status_s,failedcount=dcount_resourcerunId_s
| join (
AzureDiagnostics
| where ResourceProvider == "MICROSOFT.LOGIC"
| where OperationName has "workflowRunCompleted"
| where TimeGenerated > ago(24h)
| summarize dcount(resourcerunId_s) by resourceworkflowName_s
| project resource_workflowName_s,totalcount=dcount_resource_runiId_s
)
on resource_workflowName_s
| project
Name = resource _workflowName_s,
TotalRunsPerDay = totalcount,
FailureCount = failedcount,
PercentageFailure = (failedcount*100/totalcount)
| order by Name

