Below are the detailed steps required.
Configure Log Analytics with Azure Synapse
Provision a Log Analytic workspace from Azure Portal.
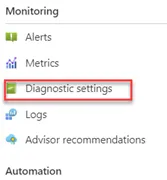
Open Azure Synapse workspace, on left side go to Monitoring -> Diagnostic Settings
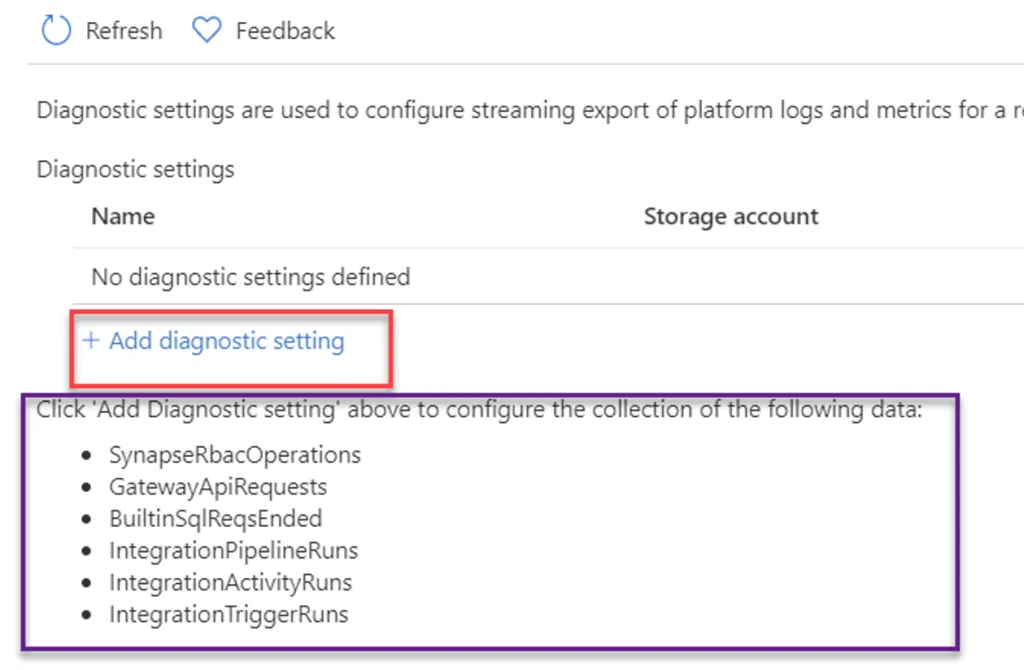
As we can see in below screenshot, we need to “add diagnostic setting” which will then push below mentioned logs to Log Analytics from Azure Synapse workspace. More details about these logs on Microsoft Documentation.
- SynapseRbacOperations
- GatewayApiRequests
- BuiltinSqlReqEnded
- IntegrationPipelineRuns
- IntegrationActivityRuns
- IntegrationTriggerRuns
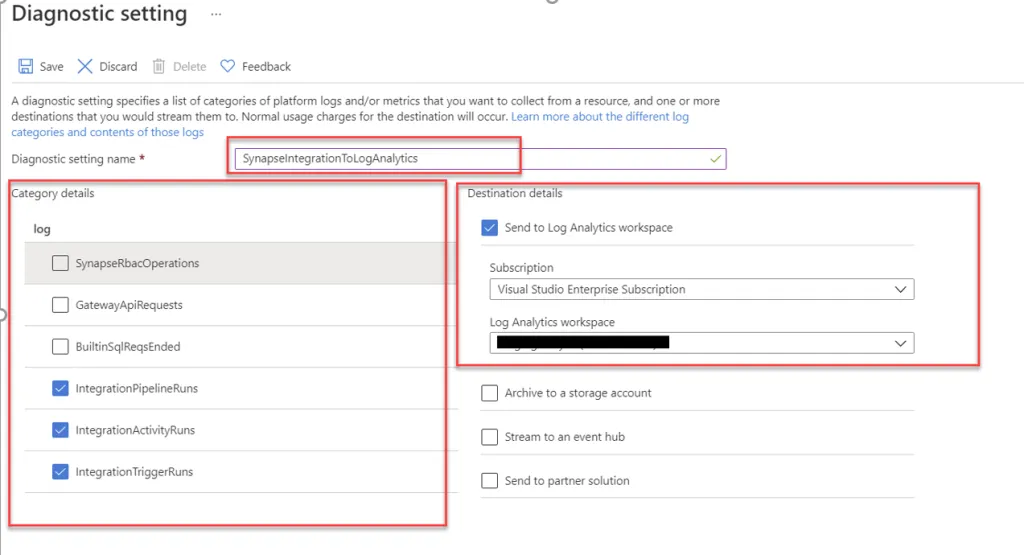
- Select relevant logs that we want to push to Log Analytics. In our case we only selected logs of type Integration that belongs to Pipelines.
- Provide name for diagnostic setting and hit save button.
The same can be done by PowerShell script:
$subscriptionId = (Get-AzContext).Subscription.Id
$metric = @()
$log = @()
$categories = Get-AzDiagnosticSettingCategory -ResourceId /subscriptions/$subscriptionId/resourceGroups/test-rg-name/providers/Microsoft.AppPlatform/Spring/springcloud-001
$categories | ForEach-Object {if($_.CategoryType -eq “Metrics”){$metric+=New-AzDiagnosticSettingMetricSettingsObject -Enabled $true -Category $_.Name -RetentionPolicyDay 7 -RetentionPolicyEnabled $true} else{$log+=New-AzDiagnosticSettingLogSettingsObject -Enabled $true -Category $_.Name -RetentionPolicyDay 7 -RetentionPolicyEnabled $true}}
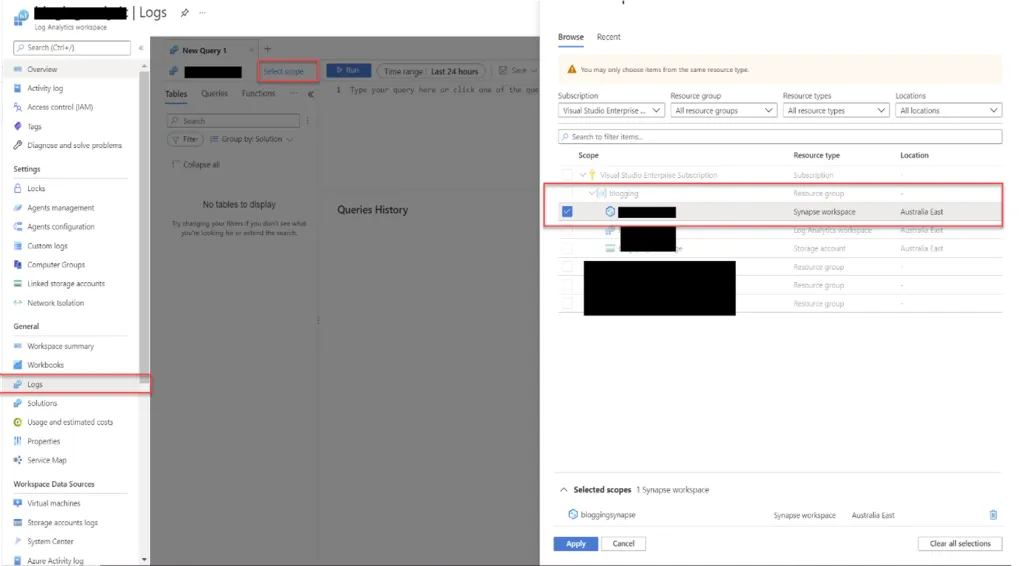
New-AzDiagnosticSetting -Name test-setting -ResourceId /subscriptions/$subscriptionId/resourceGroups/test-rg-name/providers/Microsoft.AppPlatform/Spring/springcloud-001 -WorkspaceId /subscriptions/$subscriptionId/resourcegroups/test-rg-name/providers/microsoft.operationalinsights/workspaces/test-workspace -Log $log -Metric $metric- Once, done let’s go to Log Analytics, General -> Logs, and select a scope (can be either Log Analytics or Azure Synapse workspace). The same can be done from Azure Synapse workspace.
- As we can see in the below screenshot, currently it’s all blank even though we have enabled integration between Azure Synapse workspace and Log Analytics. This is because once integration is done, all future logs will be pushed into Log Analytics, but not the old ones.
Let’s re-execute few pipelines and see if it pushes data to Log Analytics or not?

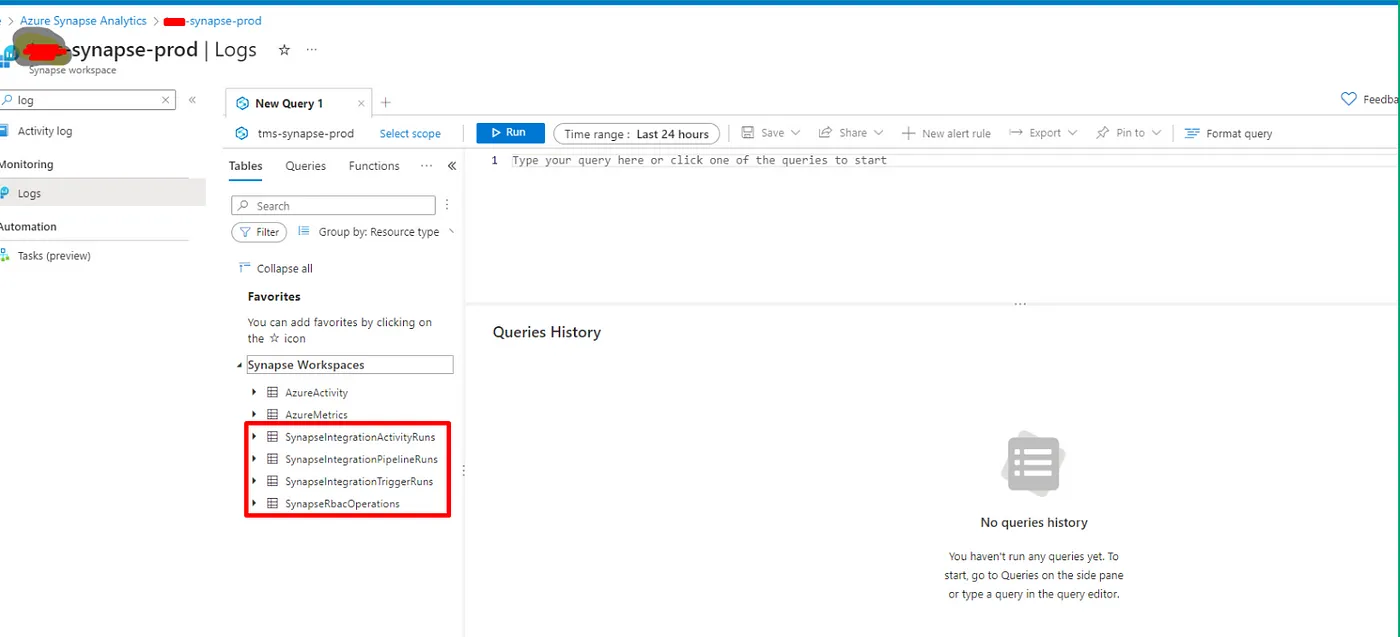
Let’s move back to Log Analytics and this time we are able to see few tables related to pipelines.
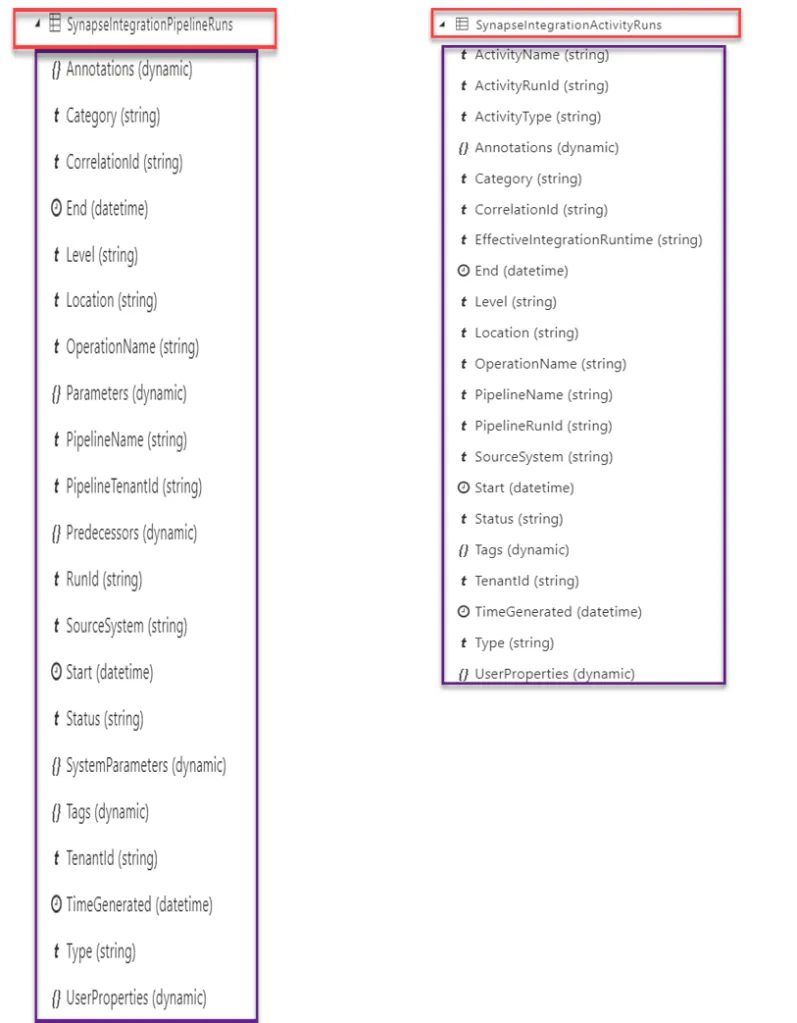
Lets explore the contents of these tables.
As we can see in below screenshot, both of the tables expose key properties/attributes which can then be leveraged for reporting/alerting purposes. Example: Pipeline Name, Pipeline RunId, Start and End Date Time, Status etc..
Query Logs In Log Analytics
Now as logs have started moving to Log Analytics, next is how to fetch these logs or query these logs. Here comes modern query language Kusto. In below screenshot, we can see we wrote a sample query to fetch information about failed runs or runs which result in error
SynapseIntegrationPipelineRuns — Provides execution details about Pipelines
SynapseIntegrationPipelineRuns
| where Level ==’Error’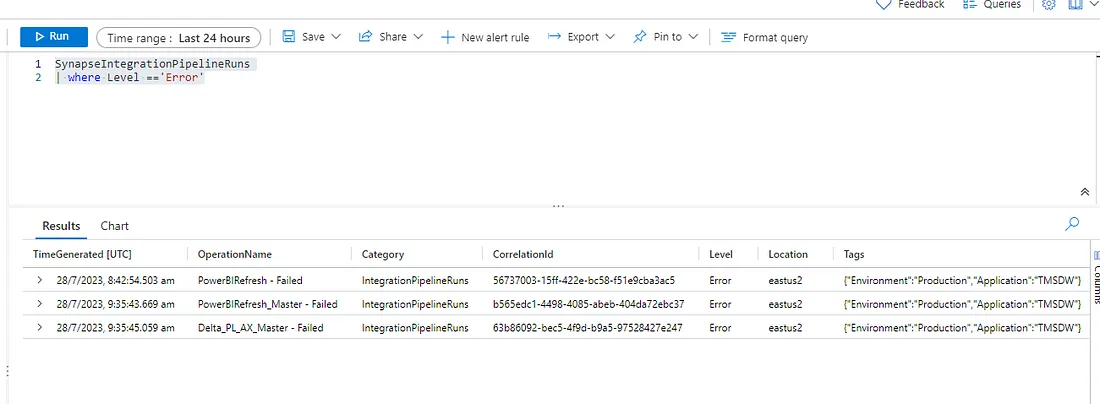
SynapseIntegrationActivityRuns — Provides execution details about Activities within a Pipeline
SynapseIntegrationActivityRuns
| where Level ==’Error’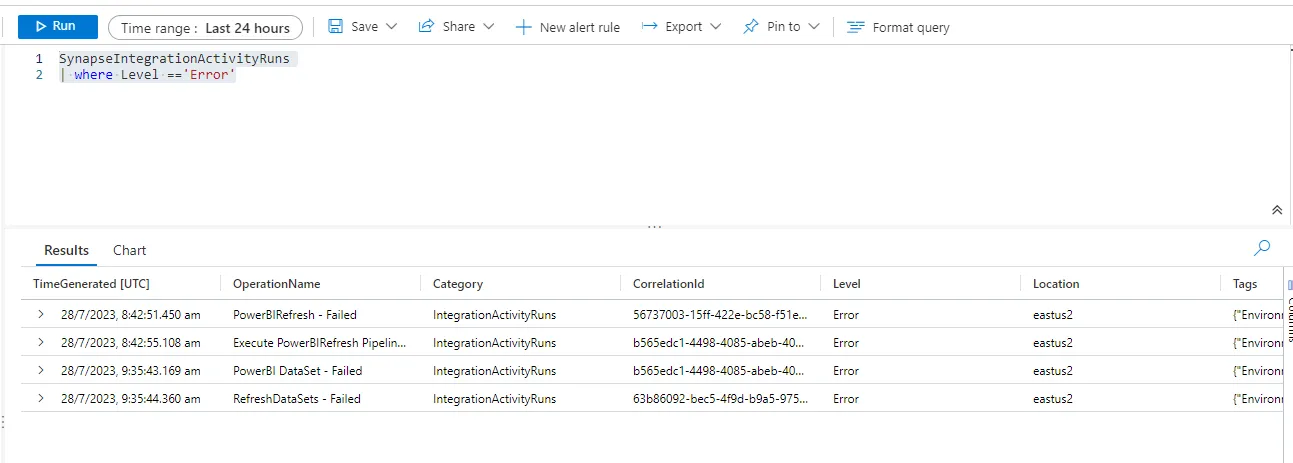
- Now above screenshots has much more information. So lets see how to narrow it down and only fetch selected values
- Let’s modify out query a bit
SynapseIntegrationPipelineRuns
| where Level == ‘Error’
| project PipelineName, PipelineRunId=RunId , Start, End, OperationName, Status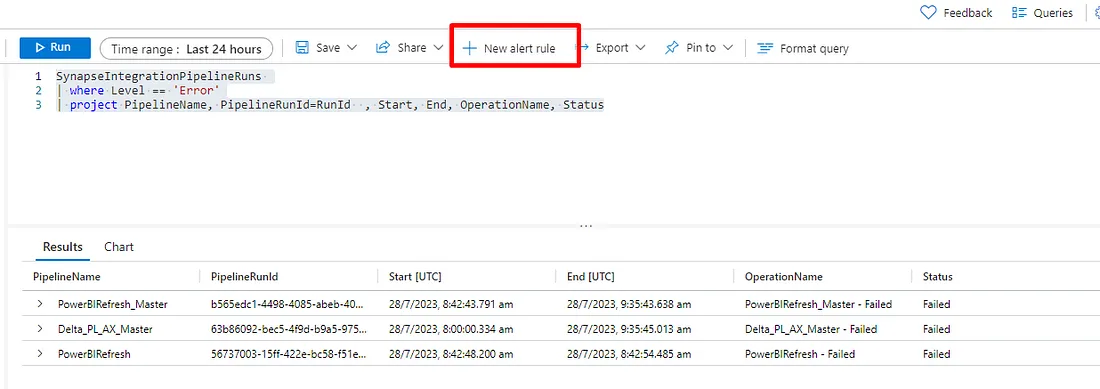
Create Alert and Send Email Notification
We can now create an alert based on this query which will interns when meet condition will send us an email alert.
Click on “New alert rule” as per above screenshot.
Please refer the microsoft documentation on how to create alerts.

